
SEO Guide
Core Web Vitals Explained (LCP, CLS, INP)
What LCP, CLS, and INP measure, the passing thresholds, common causes of poor scores, and how to actually improve them.
You already know that a slow website frustrates customers, but Google’s exact performance standards can sometimes feel like a moving target.
We have seen firsthand how failing these specific thresholds can silently drain traffic from otherwise healthy e-commerce stores.
The data shows exactly where these leaks occur and how to fix them with focused page speed optimization.
This guide provides core web vitals explained clearly, without the unnecessary developer jargon.
For implementation as part of an engagement, you can explore our Technical SEO service.
Let’s look at the data, what it actually tells us, and map out a practical route to get your scores out of the red.
The three metrics
Google uses three specific metrics to measure how a real user experiences your page. They track visual loading speed, layout stability, and interactive responsiveness.
Our audits consistently show that pages passing all three thresholds gain a small, compounding ranking benefit.
Scores are determined by looking at the 75th percentile of all real user visits. This means your site needs to deliver a fast experience to at least three-quarters of your audience to pass.
We find that focusing on this majority percentage clarifies exactly where development efforts should go.
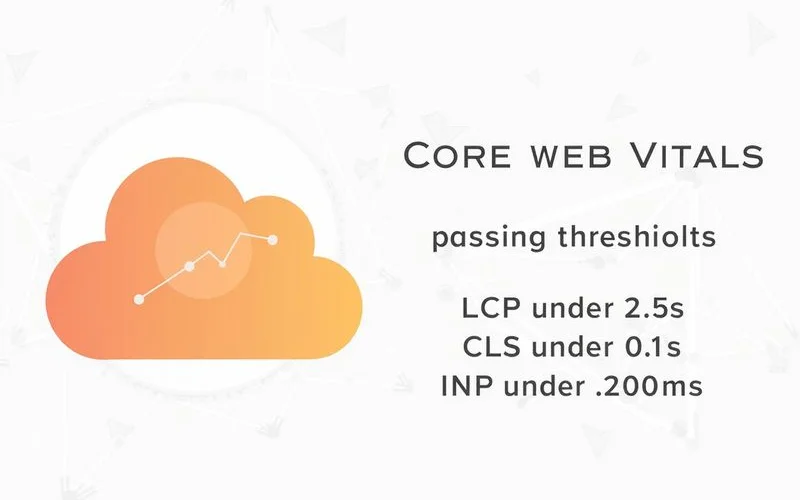
- Largest Contentful Paint (LCP): This measures how quickly the largest visible element renders in the first viewport. Typically, this is a hero image, headline, or main video. Google wants LCP to occur within 2.5 seconds of a user initiating the page load.
- Cumulative Layout Shift (CLS): This tracks visual stability during loading. When elements pop into the page and push content around, CLS rises. Google wants CLS strictly below 0.1.
- Interaction to Next Paint (INP): This measures how quickly the page responds to user interactions like clicks or taps. The longest delay between a key press and the next visual response must stay under 200 milliseconds.
A page passing all three criteria earns a “good” status from Google and secures the associated ranking benefit. Note that INP officially replaced First Input Delay as a core metric on March 12, 2024.
Where the data comes from
Google ranks your site based entirely on real-world field data, not simulated lab data. This is an important distinction that often gets missed during technical discussions.
Our technical team always starts by analyzing the field metrics before opening any diagnostic tools.
| Data Type | Source | Purpose | Update Frequency |
|---|---|---|---|
| Field Data | Chrome User Experience Report (CrUX) | Determines SEO ranking impact | 28-day rolling average |
| Lab Data | PageSpeed Insights, Lighthouse | Diagnostics and local testing | Real-time |
The Chrome User Experience Report collects anonymous performance statistics from actual Chrome users on real connections. This specific dataset populates the Core Web Vitals report inside Google Search Console.
We rely on this 28-day rolling average because it reflects what actual customers experience on the live web.
Lab data comes from synthetic tests run in a controlled environment. These simulated runs are incredibly useful for catching specific coding errors. Optimising for lab scores without verifying the field data is a common, expensive mistake.
When mastering lcp cls inp requirements, use lab tools to diagnose issues, but trust field data for the final ranking impact.
Common causes of poor LCP
Largest Contentful Paint fails most often due to oversized images and slow server response times. Recent 2026 industry data indicates that only about 62% of sites globally manage to pass this specific threshold.
Our analysis of local Malaysian websites reveals several recurring bottlenecks.
- Uncompressed hero images: A 2MB hero image easily takes 2 to 4 seconds to download on a standard mobile connection. While Malaysia’s median mobile internet speed reached 143 Mbps in 2026, network latency still severely penalizes large files. Compressing that image to 150KB drops the load time to a fraction of a second.
- Slow server response: A Time to First Byte (TTFB) over 600ms renders every other optimization useless. Upgrading to a premium hosting tier or using an advanced caching solution like LiteSpeed Cache is often necessary.
- Render-blocking CSS and JavaScript: Browsers must parse stylesheets and scripts in the
<head>section before rendering anything. Deferring non-critical scripts and inlining critical CSS for above-the-fold content fixes this delay. - Web fonts loading too late: Custom fonts frequently delay text rendering. You should use
font-display: swapor preload key typography assets. - Heavy third-party scripts: Analytics trackers and advertising tags often load before the main content. Loading these asynchronously prevents them from blocking the hero element.
Common causes of poor CLS
Layout shifts happen when elements like late-loading ads or unmeasured images push existing content around. Current 2026 statistics show that over 80% of websites successfully pass the CLS requirement, making it the most achievable target.
Our developers usually fix these visual stability issues with a few strategic lines of CSS.
- Images without dimensions: Setting explicit
widthandheightattributes on<img>tags reserves the necessary layout space. This prevents the entire page from shifting downward when the image finally renders. - Late-injected content: Sticky banners, pop-ups, or embedded TikTok Shop product feeds often appear late and push text away. You must reserve a fixed minimum height for these containers or render them in fixed-position overlays.
- Late-loading ad banners: Dynamic advertisements frequently take an extra second to load. Reserving space with a
min-heightproperty on the ad container prevents sudden content jumps. - Font swaps: A layout shift occurs when a custom web font replaces a slightly smaller fallback font and causes text reflow. Using matched fallback font metrics minimizes this disruption.
Common causes of poor INP
Interaction delays are almost always caused by heavy JavaScript blocking the browser’s main thread. While the passing threshold is 200 milliseconds, any delay over 500 milliseconds feels noticeably laggy to a customer.
Our team sees interaction delays most frequently on highly customized e-commerce themes.
- Third-party widgets: Customer service tools like Tawk.to or social media embeds routinely block input for hundreds of milliseconds. Delaying their initialization until after the main content loads is crucial.
- Heavy JavaScript execution: Long-running scripts paralyze the browser’s main thread. Splitting this work into smaller tasks and using web workers for heavy computation allows the browser to respond to user clicks faster.
- Slow event handlers: Click or input handlers that attempt to do too much synchronously cause immediate lag. Non-essential background work should be deferred to
requestIdleCallback. - Excessive React, Vue, or Svelte re-renders: Single-page applications sometimes update components unnecessarily upon every click. Memoise expensive components and flatten state where possible to prevent this processing waste.
- Layout thrashing: Code that rapidly reads and writes layout properties forces the browser to recalculate positions repeatedly in loops.
How to improve LCP, CLS, and INP
Improving these metrics requires a phased approach, starting with quick image compression and ending with complex JavaScript reduction. Systematic improvements yield much better results than random technical tweaks.
We follow a strict, practical sequence during technical retainers to ensure maximum impact.
The Remediation Sequence
- Week 1: Audit and prioritise. Pull the CWV data from Google Search Console to identify failing URL patterns. PageSpeed Insights helps diagnose the largest contributing elements per page.
- Week 2: Quick wins. Implement image compression by switching to modern WebP or AVIF formats, which drastically reduces file size. Add width and height attributes to all images, and defer non-critical scripts. These changes often fix LCP and CLS on most pages immediately.
- Weeks 3 to 4: Medium-effort fixes. Focus on inlining critical CSS and auditing third-party scripts. Server response times should be improved via advanced caching configurations.
- Weeks 5 to 8: Deep INP work. This phase usually requires dedicated developer time on the application layer. Tasks include optimizing event handlers, splitting JavaScript, and reducing render thrash.
- Week 9 and beyond: Monitor and iterate. Because field data updates on a 28-day rolling cycle, patience is required. Improvements show up gradually as the data window incorporates the new, faster user sessions.
Platform-specific CWV considerations
Your CMS platform dictates your optimization strategy, as Shopify, WooCommerce, and Astro all handle resources differently. Understanding your platform’s inherent strengths saves hours of misguided development time.
We approach a custom static site very differently than a massive e-commerce database.
Platform Insights
- Shopify: This platform handles LCP and CLS exceptionally well by default. However, with roughly 28% global market share, Shopify stores frequently struggle with INP due to the heavy JavaScript injected by third-party marketplace apps. You must audit your installed apps and remove any that add measurable interaction delay.
- WooCommerce: Performance here is highly variable and depends heavily on hosting, theme, and plugin choices. Sites on cheap shared hosting with bloated page builders will fail all three metrics. Upgrading to a LiteSpeed-powered premium host transforms WooCommerce performance and resolves server delays cleanly.
- Astro and static sites: These frameworks typically perform excellently because they ship minimal JavaScript to the browser. When issues do arise, they are usually traced to specific oversized images or external scripts rather than the framework itself.
How much do CWV affect rankings really?
Core Web Vitals act as a tie-breaker in search rankings and a primary driver for e-commerce conversion rates. The actual SEO impact of page speed sits somewhere between absolute panic and total dismissal.
We view performance as a foundational requirement rather than a magic ranking bullet.
The True Value of Speed
The March 2024 core update reinforced that core web vitals seo efforts are just one part of Google’s broader page experience signal. A site failing all three metrics in a highly competitive niche will slowly lose ground to faster competitors.
Content relevance and high-quality backlinks still matter more for overall positioning.
“Recent e-commerce studies from 2026 show that improving load times can boost conversion rates by up to 30%, making speed a direct revenue driver.”
However, the strongest case for technical optimization has nothing to do with search engines. Pages that load fast and respond responsively convert significantly better.
Our clients consistently report that faster pages directly improve their bottom line.
The investment in technical speed pays for itself in higher sales, even if the direct ranking benefit were zero.
Where to start
If your Search Console shows failing URLs, you need a dedicated technical audit to map out specific fixes. Ignoring red status warnings across most URLs will eventually catch up with your organic traffic.
Our Technical SEO service treats CWV as a priority area in every retainer, and standalone audits include a CWV remediation roadmap as a deliverable.
Taking action now ensures your site remains competitive, visible, and highly profitable.